Physical explanations on the observations
[Back]
3. Explanation on the depth-varying/frequency-dependent coseismic radiation during megathrust earthquakes
Megathrust earthquakes exhibit a ubiquitous seismic radiation style: low-frequency (LF) seismic energy is efficiently emitted from the shallowest portion of the fault, whereas high-frequency (HF) seismic energy is efficiently emitted from the deepest part of the fault. Although this is observed in many case-specific studies, we show that it is ubiquitous in global megathrust earthquakes between 1995 and 2021. Previous studies have interpreted this as an effect of systematic depth variation in either the plate interface frictional properties (Lay et al., 2012) or the P wavespeeds (Sallarès & Ranero, 2019). Our dynamic simulation work suggests an alternative hypothesis: the interaction between waves and ruptures due to the Earth’s free surface is the leading mechanism that generates this behavior. Two-dimensional dynamic rupture simulations of subduction zone earthquakes support this hypothesis. Our simulations show that the interaction between the seismic waves reflected at the Earth’s free surface and the updip propagating rupture results in LF radiation at the source. In contrast, the downdip propagation of rupture is less affected by the free surface and is thus dominated by HF radiation typical of buried faults. To a second degree, the presence of a realistic Earth structure derived from P-wave velocity (V$_P$) tomographic images and realistic V$_P$/V$_S$ ratio estimated in boreholes further enhances the contrast in source radiation. We conclude that the Earth’s free surface is necessary to explain the observed megathrust earthquake radiation style, and the realistic structure of subduction zone is necessary to better predict earthquake ground motion and tsunami potential. The paper of this work has been accepted by AGU Advances (Here)
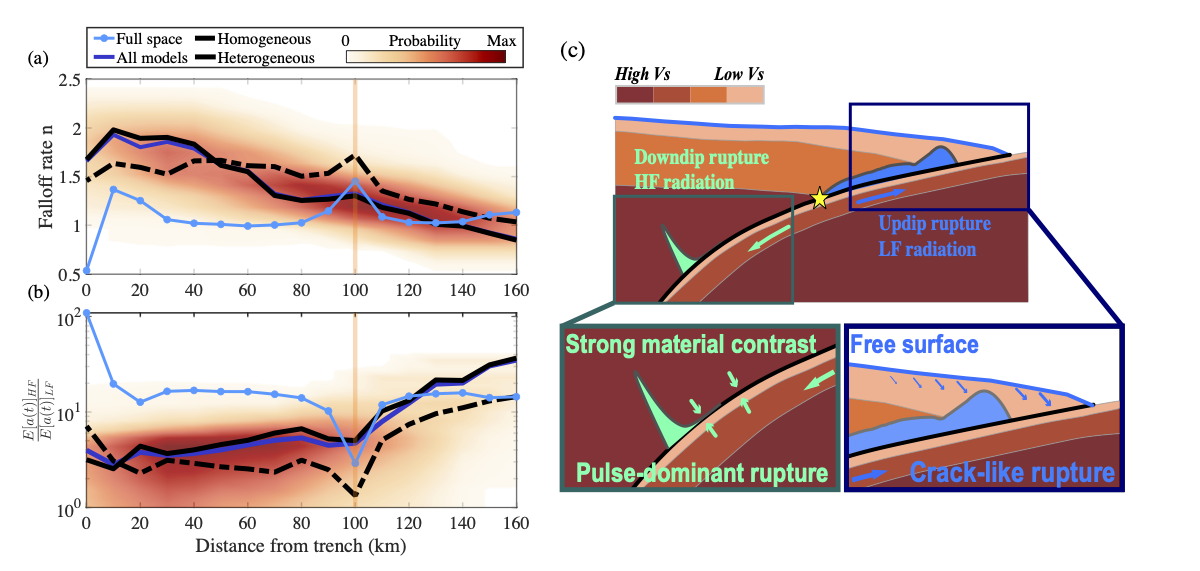
Spectral properties of the source radiation, shown by the probability distribution from all models. These distributions are obtained from the Box-kernel smoother. (a) Best-fitted spectral falloff rate $n$ along dip from the simulated megathrust earthquake with different model settings. (b) The power ratio of high frequency (HF) 0.06 - 0.3 Hz and low frequency (LF) 0.001 - 0.06 Hz slip acceleration along dip. Dark blue solid line shows the median value of all models. Black dashed line and solid line show the median values from all homogeneous models and all heterogeneous models, respectively. The light blue dotted line shows the result from the homogeneous full-space model. The orange bar indicate the location of rupture nucleation. (c) Schematic cartoon shows the effects of the free surface and material contrasts on the dynamic behavior of megathrust earthquakes. In the updip region, the free surface leads to crack-like rupture (slip-rate distribution is shown in blue) and enhanced low-frequency radiation. In the downdip part, the substantial material contrast at the top of the LVZ favors pulse-dominant rupture (slip-rate distribution is shown in green) and enhanced high-frequency seismic radiation.
2. Dynamics implied from the population behaviors of earthquake STFs
We developed different metrics to extract physical information from a large population of earthquake source time functions (mainly the SCARDEC STF database). Gaussian-subevent decomposing (please see here) and DTW clustering (please see here) source time functions provides us a lot of new observations. In order to investigate possible factors that control the STF complexity patterns, we perform a large number of 2-dimensional dynamic rupture simulations with stochastic distributions of pre-stress, and apply the same metrics to the resulting synthetic STFs as to the SCARDEC STFs. We have two main findings: 1) heterogeneity in the stress field on the fault interface is necressary to reproduce the large STF variability observed from our subevent-decomposition results; 2) variation of frictional parameters can obviously change the group proportions of STFs from our DTW clustering. All those results imply that there is very important dynamic information hidden in the earthquake variability, and it is very helpful for constaining rupture dynamics from the analysis on population behaviors of large samples of earthquake STFs. Please refer to our papers for more detailed discussions (Gaussian-subevent decomposition: Danré et al.,(2019); DTW clustering: Yin et al., (2021))
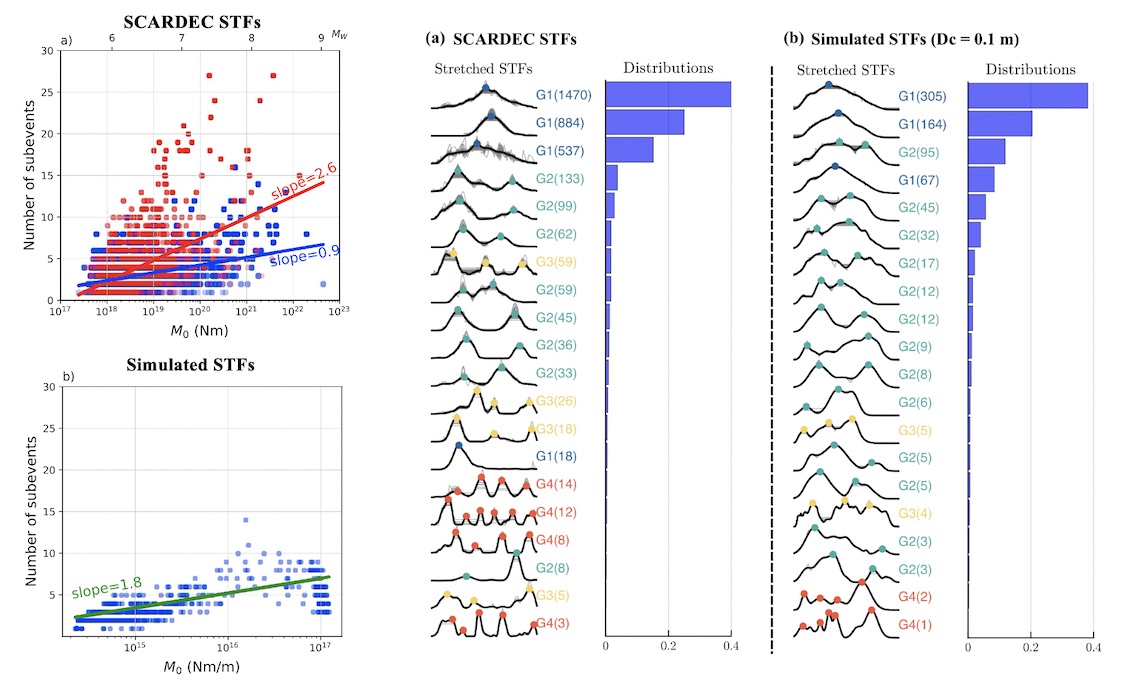
Comparison between the SCARDEC STFs and the synthetic STFs from 2D dynamic simulations: (Left) Number of subevent; (Right) DTW stretched STFs.
1. Relation between the backprojection images and earthquake source kinematics on the fault
Although the BP methods have been successful in studying large earthquakes, the physical interpretations of the BP results are still not clear. All those previous comparisons between independent methods are qualitative. The explanation of BP with respect to energy is probably not incorrect, but is limited by the perspective of seismic signal processing instead of source physics. Obviously, better understandings on the BP images and their relation to the physics of earthquake rupture is significant and highly needed. In this study, we start from the theoretical formulation of the BP images, which is linear in the frequency domain, and carry on a synthetic exercise in a homogeneous fullspace. We find that the fundamental linear formulation of the BP method is most correlated with the true kinematic source properties: the images \(U_{BP}(\omega)\) from linear BP is a snapshot of the slip motion \(U(\omega)\) on the fault plane after a spatial smoothing with a frequency-dependent resolution matrix \(F(\omega)\):
\[U_{BP}(\omega) = F(\omega)U(\omega)\]This direct relation between BP image and source kinematics helps to better understand and interpret the BP observations of the real earthquake rupture. For more details, please see Yin and Denolle (2019 GJI).
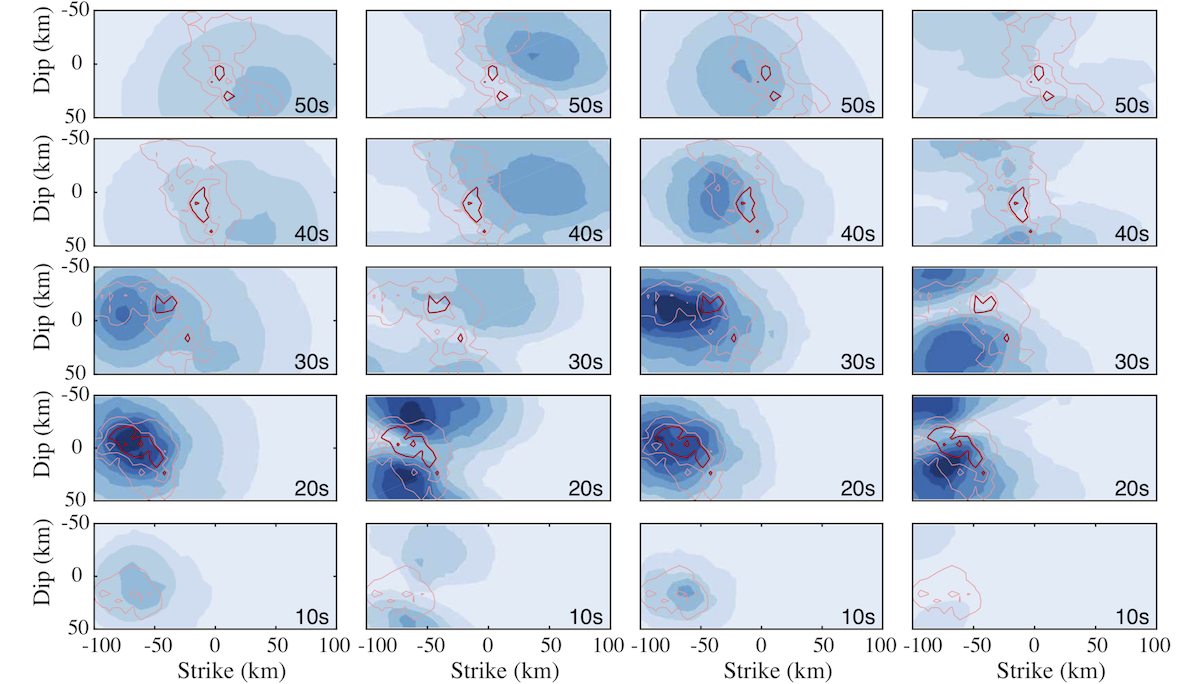
Direct comparisons between the kinematic rupture models (red contours show the slip rate distribution at each snapshot) and BP images (color images) recovered from 4 different synthetic arrays. More details about the array settings can be found here.
[Back]